(+44) 20 3287 0255
Call us for enquiry
-
-
Connect On Whatsapp (+44) 1618187774
Uninterrupted Access 24x7, 100% Confidential. - Connect Now

The article aims to discuss correlation, which is an important statistical tool for data analysis and identifying the interrelationship between the variables. In statistical analysis, correlation or dependence is considered as a statistical relationship, whether causal or not, between two random variables or bivariate data in the whole data set. In the market, researchers use correlation analysis to analyze quantitative data collected through surveys and live polls to identify the relationship, patterns, and trends between two variables or datasets.
Correlation is any statistical association, though it commonly refers to the degree to which a pair of variables is linearly related. A high correlation point indicates a strong relationship between the two variables, while a low correlation means that, the variables are weakly related to each other. The correlation coefficient (r) is a measure that determines the degree to which the movement of two different variables is. Hence, through the value of r, it is possible to analyse the relationship between the two variables. As per Spearman’s Rank Correlation Coefficient, the value of r is,
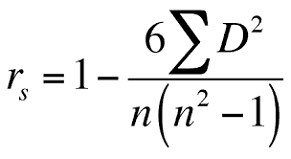
-1 ≤ r ≤ +1, where r is equal to zero means that there is no such relationship between the two variables in the data set and in this case, the researchers can reject the null hypothesis in the thesis paper. On the other hand, a positive correlation coefficient means the variables are positively correlated to each other, which indicates an increase in one variable will raise another variable in the data set. A negative correlation further refers to a negative correlation between the variables.
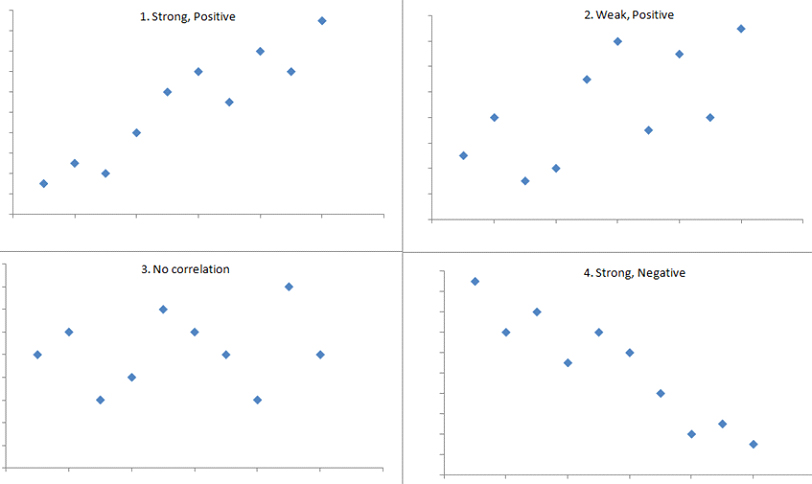
Any score from +0.5 to +1 indicates a very strong positive correlation, which indicates the line in the correlation mapping will be an upward sloping line, and both the variables increase at the same time. The second picture shows a weak or positive correlation, as the points are scattered across the places, whereas the third picture indicates no correlation between the variables as there is no such relationship between the variables and the points are scattered. The fourth picture indicates a negative correlation, as the scatter plot shows a downward-sloping curve. Any score from -0.5 to -1 is indicated as a strong negative correlation, which means that as one variable increases, the other decreases proportionally.
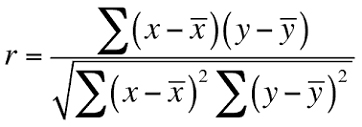
Through this formula, it is also possible to explore the correlation coefficient to test the hypothesis by identifying the interrelationship between the two variables.
The researchers utilise correlation analysis to analyse the dependent variables and their influential impacts on the dependent variable. It is helpful for the researchers to identify the interrelationship between the variables and it further helps the researchers to test the research hypothesis, whether to reject the null hypothesis or not. The Pearson correlation and Spearman’s Rank Correlation Coefficient are widely utilised to run the correlation analysis in the thesis paper so that the researchers can identify the internal linkage between the two variables. In general, correlation tends to be used when there is no identified response variable. For numerical data analysis, it is effective and the researchers try to utilise this technique to develop descriptive statistical analysis in the research. As an end note, the applications of correlation-based statistical consulting allows researchers to identify which aspects and variables are dependent on each other so that they can dig deeper to generate actionable insights or starting points for further investigations.
Our SPSS help team measures the strength of association or co-occurrence between two variables. We’ve embraced a flexible working environment and cloud-based culture to ensure your queries are answered very promptly.